Data Usage
This section monitors data usage patterns, including app-specific and network-related metrics, to enhance device efficiency.
Total Data Usage Graph:
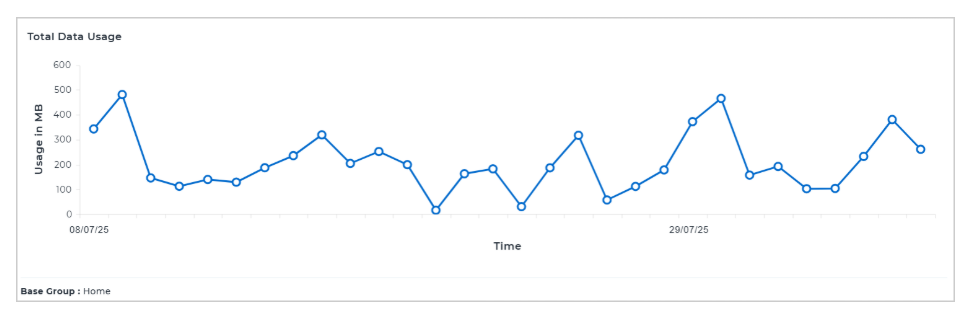
The Total Data Usage chart represents the overall data usage trends across devices. The x-axis displays dates, while the y-axis shows data usage in megabytes (MB), making it easy to visualize and track changes in total data consumption over time.
Total Mobile Data Usage:
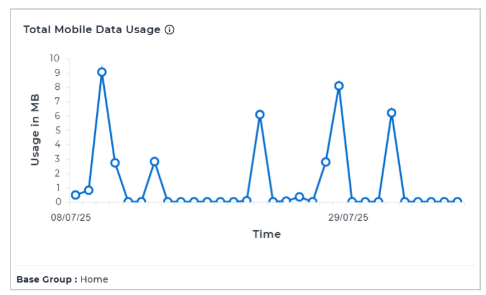
The Total Mobile Data Usage chart represents daily mobile data usage across devices. The x-axis displays dates, while the y-axis shows data usage in megabytes (MB), making it easy to monitor and evaluate changes in mobile data consumption over time.
Top Mobile Data Usage in Apps:
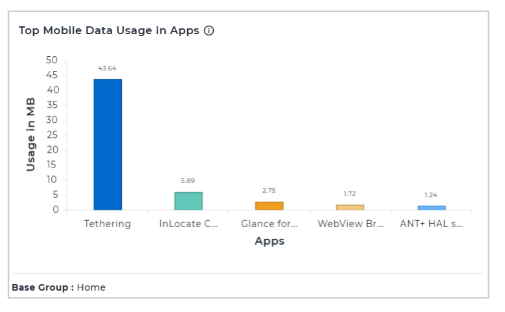
The Top Mobile Data Usage in Apps chart represents apps with the highest mobile data usage. The x-axis lists the app names, while the y-axis shows the amount of mobile data each app has used in megabytes (MB), making it easy to identify which applications are driving the most mobile data consumption.
Total Roaming Data Usage:
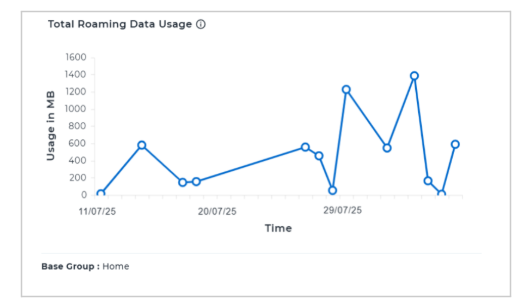
The Total Roaming Data Usage chart represents the distribution of roaming data usage across devices. The x-axis displays dates, while the y-axis shows data usage in megabytes (MB), making it easy to monitor how roaming data consumption varies over time.
Top Roaming Data Usage in Apps
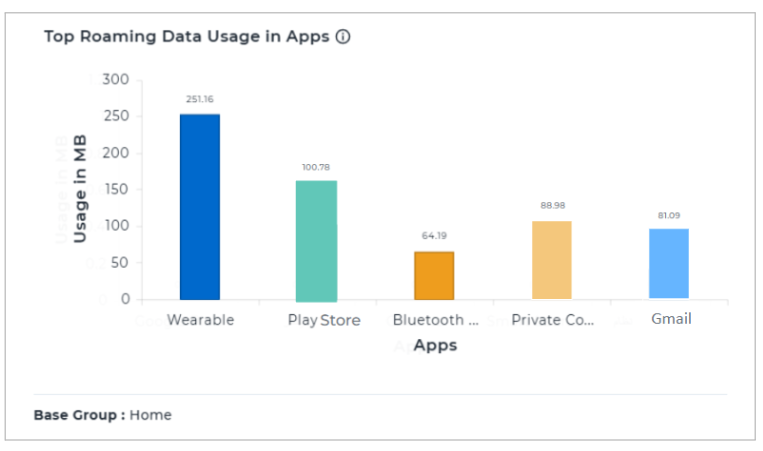
The Top Roaming Data Usage in Apps chart represents apps with the highest roaming data usage. The x-axis lists app names, while the y-axis shows the amount of roaming data each app has used in megabytes (MB), making it straightforward to identify which applications are responsible for the most roaming data consumption.
Total WiFi Data Usage Graph:
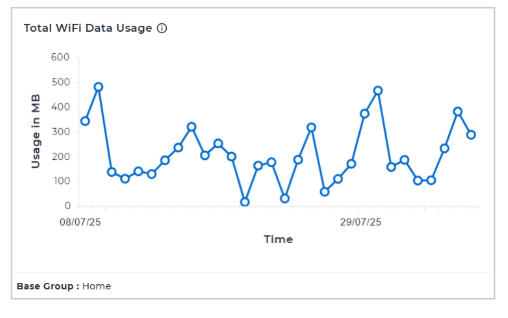
The Total WiFi Data Usage Bar Graph represents each day, with the y-axis showing data usage in MB and date/time details included. The graph updates with filters. This helps assess WiFi usage, optimizing network infrastructure and bandwidth allocation.
Top WiFi Data Usage in Apps:
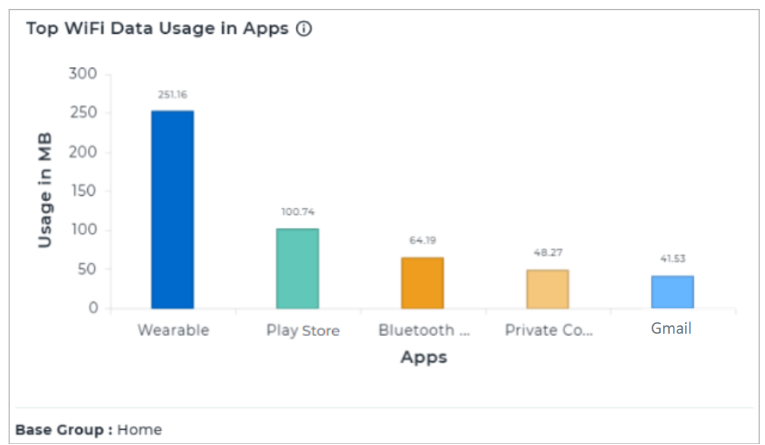
The Top WiFi Data Usage in Apps chart represents the top five apps with the highest WiFi data usage. The x-axis lists the app names, while the y-axis shows the WiFi data consumed by each app in megabytes (MB), making it easy to identify which applications are using the most bandwidth.
In the application usage bar charts, clicking on any application bar would drill down, displaying data usage by different versions of that app, providing detailed insights into version-specific consumption.