Dashboard
The SureMDM Web Console boasts an HTML5-based dashboard with a dynamic and user-friendly interface. Admins can create multiple dashboards, multiple charts for each dashboard, access dashboards based on different roles and user permissions, and more. The Dashboard provides a high-level view of your entire fleet of devices, allowing you to monitor them all. You can view graphical representations of relevant device information for your fleet, such as device details, device status, alerts & notifications, compliance statistics, and OEM configuration status. You can also create some custom charts to monitor your fleet of devices.
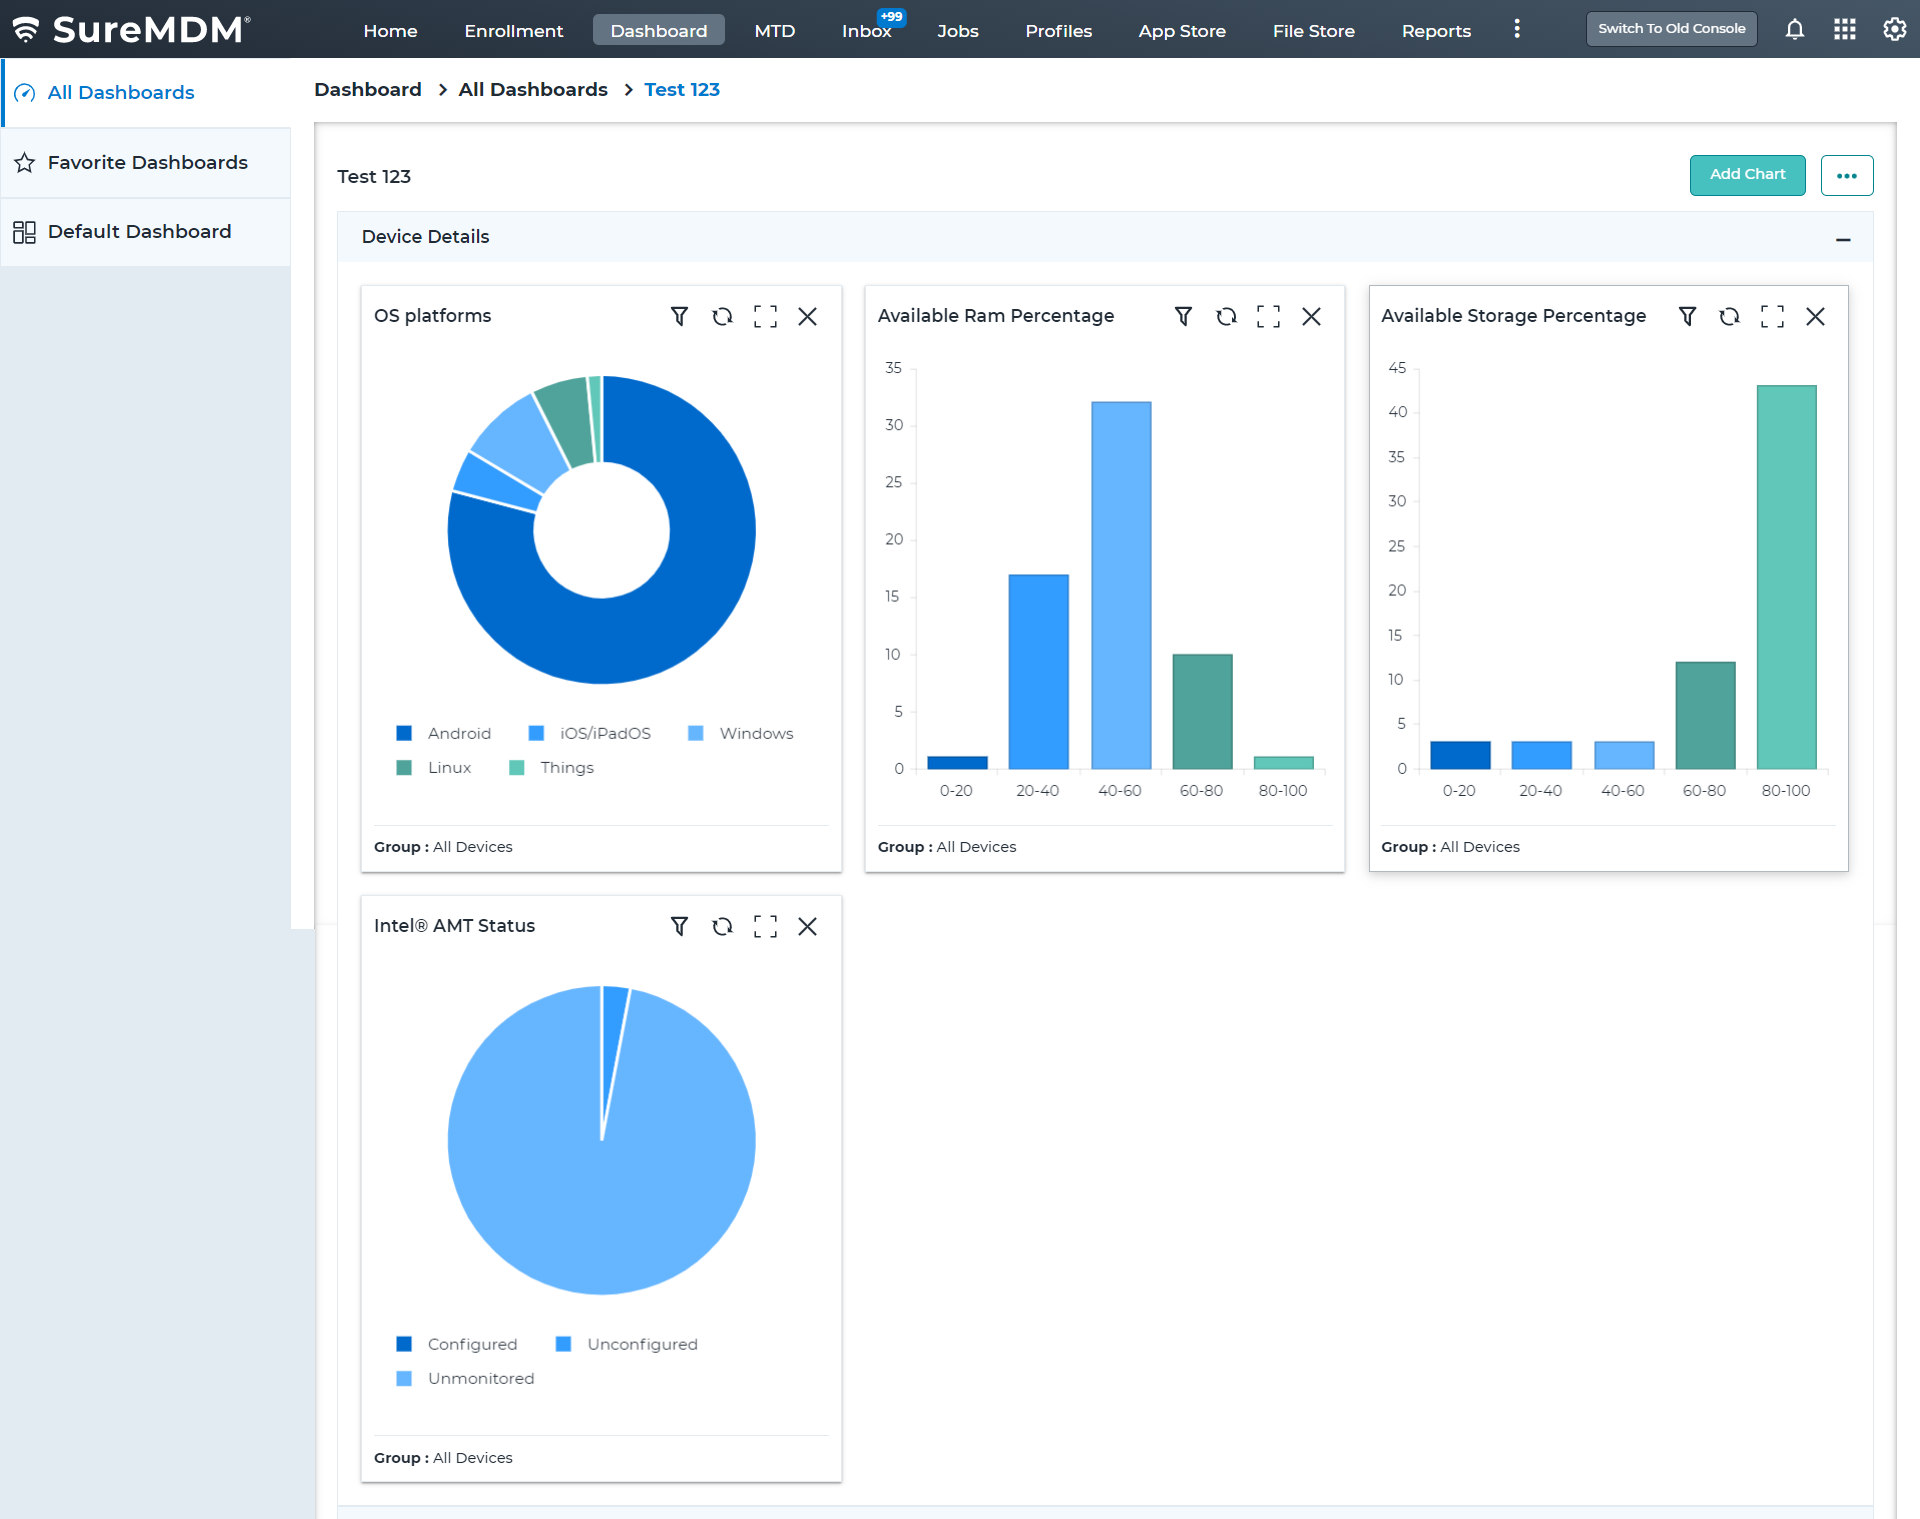
Device Details
View the graphical representation of the details of your device fleet. Selecting any of the following charts displays a graphical view of device details.
OS Platforms(Donut Chart) - Graphical view representing the number of OS platforms available in the SureMDM console.
Available Battery Percentage - Graphical view representing the available battery percentage of the devices in your fleet.
Available RAM Percentage - Graphical view representing the available RAM percentage of the devices in your fleet.
Available Storage Percentage - Graphical view representing the available storage percentage of the devices in your fleet.
Data Usage Status(Mobile Data) - Graphical view representing the mobile data usage on the devices in your fleet.
Intel® AMT Status - Graphical view representing the status of the Intel AMT.
OS Build Number - Graphical view representing the devices list based on the OS build number.
OS Build Version — Distribution of OS build versions across devices, useful for update planning and compatibility verification
Device Status
View the graphical representation of the status of your device fleet, like online/offline, last connected, and more. Selecting any of the following charts displays a graphical view of the device status.
Last Connected - Graphical view representing the last connected details of the device in your fleet.
Online / Offline - Graphical view representing the online/offline status of the device in your fleet.
Device Sim Status - Graphical view representing the sim status of the device in your fleet.
Roaming Status - Graphical view representing the roaming status of the device in your fleet.
Status Icon for Threats:
- The device is clean: The device is free from threats.
- The device is infected: The device has been identified as infected.
- The device is unscanned: The device has not been scanned yet.
Alert & Notifications
View the graphical representation of the following alert notifications. Selecting any of the following charts displays a graphical view of the alert notification.
Unread Mail - Numerical representation of the unread messages in the SureMDM console.
Unapproved Devices - Numerical representation of the unapproved devices in the SureMDM console.
Jobs - Graphical view representing the status of the jobs in the SureMDM console.
OS Updates - Graphical view representing the OS update status for your fleet of devices.
FOTA Registration Status - Graphical view representing the FOTA registration status for your fleet of devices.
Compliance Status
View the graphical representation of the compliance status of the devices. Selecting any of the following charts displays a graphical view of the compliance status.
Overall Compliance - Graphical view representing the overall compliance for your fleet of devices.
OS Version - Graphical view representing the OS version of the devices in your fleet.
Rooted Compliance - Graphical view representing the rooted compliance status of the devices in your fleet.
Security Patch Level - Graphical view representing the security patch status of the devices in your fleet.
Online Device Connectivity - Graphical view representing the device connectivity compliances of the device in your fleet.
SIM Change - Graphical view representing the SIM compliance status of the device in your fleet.
Password Policy - Graphical view representing the password compliance status of the device in your fleet.
Battery - Graphical view representing the battery compliance status of the device in your fleet.
Cell Signal Strength – Graphical view of device cellular signal strength.
WI-Fi Signal Strength - Graphical view representing the Wi-Fi signal compliances of the device in your fleet.
Blocklisted Applications - Graphical view representing the application compliance status of the device in your fleet.
Mobile Network Connectivity - Graphical view representing the network compliance status of the device in your fleet.
Windows Health Attestation - Graphical view representing the health attestation status of the Windows device in your fleet.
Active Kiosk Application - Graphical view representing the kiosk application status of the device in your fleet.
Windows Copy Genuine Validation - Graphical view representing compliance status of the Windows OS is genuine or not.
Windows Update - Graphical view representing the compliance status based on Windows updates of the device in your fleet.
Device Storage - Graphical view representing the compliance status based on the storage of the devices in your fleet.
Device Temperature – Graphical view of device temperature readings
Mobile Threat Defence - Graphical view representing the compliance status based on MTD in your fleet of devices.
Location Access - Graphical view representing the compliance status based on location access of the devices in your fleet.
Hardware Change - Graphical view representing the compliance status based on the hardware change in your fleet of devices.
Custom Rule - Graphical view representing the compliance status of the Things devices in your fleet.
Application Version
- App Version - View the graphical representation of the versions of the particular application installed on the devices.
OEM Configuration Status
View the graphical representation of the configured status of the OEM or managed applications in the SureMDM console by selecting the following chart.
- Knox Service Plugin (For Samsung) - Graphical view representing the configured status of Knox plugin services of the Samsung devices in your fleet.
Custom Data Analytics
Admins can create custom data analytics charts for the devices available in the SureMDM console. Admins are able to create the following widgets:
Device Count - With this option, admins can configure a widget that will represent the analytics data as a graph with comparisons.
Aggregation - With this option, admins can configure a widget to show analytics data as a graph without any comparisons. It simply plots Time Span against the overall Aggregate Value.
Map Analytics - With this option, admins can calculate each service operator's aggregate phone signal strength at specific latitudes and longitudes on the map within the specified signal radius. To know how to add custom analytics, see Custom Data Analytics