Battery Usage
This section tracks battery consumption patterns, including app-specific and data-related metrics, to optimize device performance.
Foreground App Battery Usage:
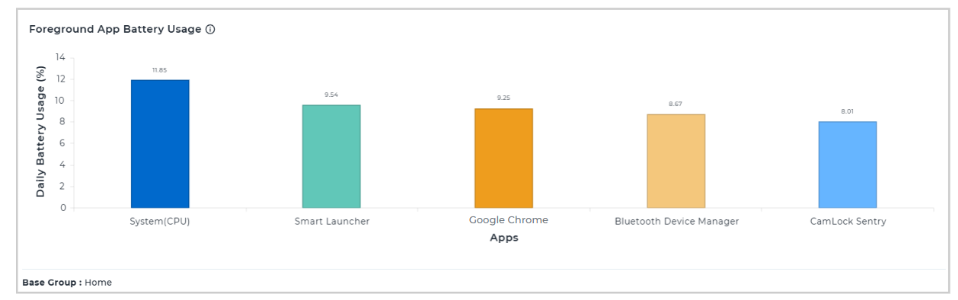
The Foreground App Battery Usage chart represents battery consumption of the top five foreground apps used across the devices. The x-axis displays the app names, while the y-axis shows the daily battery usage percentage for each app, allowing for a clear comparison of which applications consume the most battery power.
Device Screen-On Time:
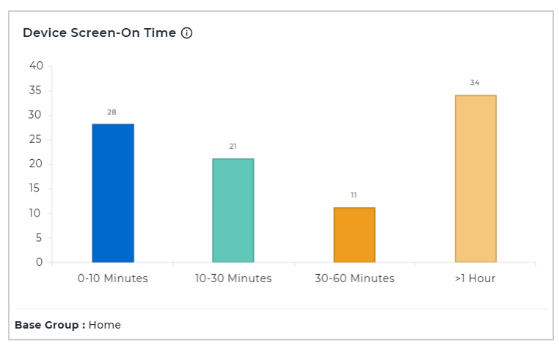
The Device Screen-On Time chart represents the distribution of screen-on time across devices. The x-axis displays different screen-on time ranges, while the y-axis shows the number of devices within each range, making it easy to assess how long devices are typically active.