Application Usage
This section provides insights into how applications are used across devices, helping administrators optimize performance and resource allocation.
App Usage with Max Daily Screen Time Bar Graph:
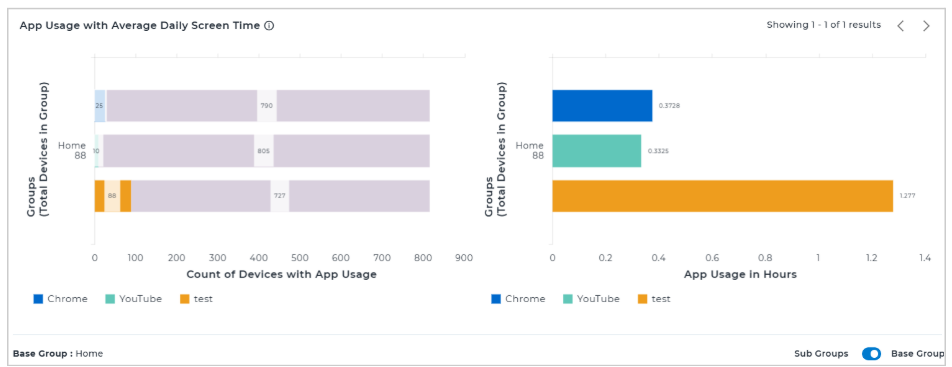
The chart is separated into two sections:
- Device Count by Application Usage:
- This section displays the number of devices utilizing each application.
- Each color on the chart represents a different application.
- Each bar in the chart is segmented to display count of devices with respective application usage
- The x-axis denotes the count of devices, while the y-axis lists the group names with the corresponding device counts.
- Application Usage Duration:
- This section presents the average usage duration of respective application measured in hours.
- The x-axis represents hours of usage, while the y-axis displays the group name.
Summary:
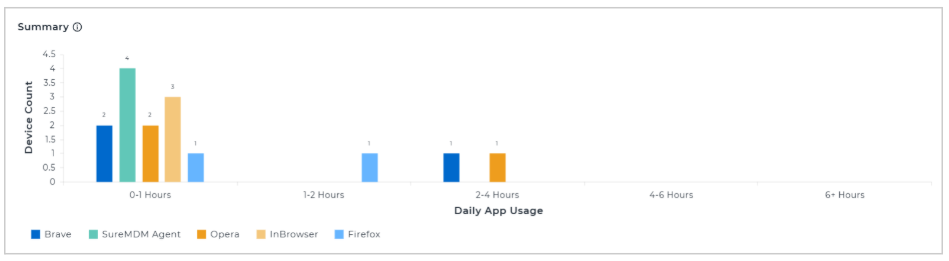
The Summary bar graph presents an overview of device activity by grouping devices into daily app usage ranges, the x-axis displays the usage intervals in hours, while the y-axis shows the number of devices within each range, with distinct bars for each application to make comparison straightforward.