SIEM Integration
SureMDM enhances security and amplifies visibility by integrating seamlessly with Security Information and Event Management (SIEM) systems. This integration bridges the gap between device management and security intelligence, offering a comprehensive solution that enables organizations to proactively monitor, detect, and respond to security threats across their mobile ecosystem. The SIEM system monitors and analyzes network and hardware activities inside the enterprise environment. 42Gears UEM has integration with the SIEM tool - Splunk, to transfer system activity logs and device activity logs.
Splunk Configuration
To configure in Splunk, follow these steps:
Navigate to Splunk and create an account.
After the successful creation of an account, go to Instances and click Access Instances.
Click Settings > Data Inputs.
In the Data Inputs section, click HTTP Event Collector.
In the HTTP Event Collector section, click New Token.
Enter a Name and click Next.
In the Input Settings section, select the following options and click Review.
- Source Type - Automatic
- App Context - Search \& Reporting(search)
- Index - Main
Check the entered details and click Submit.
Token will be generated and displayed as Token Value.
Navigate back to HTTP Event Collector section and click Global Settings.
In the Edit Global Settings prompt, select Enabled for All Tokens and click Save.
In the HTTP Event Collector section, copy the Token Value and URL (displayed on the browser).
Token Value and URL copied here will be used while configuring SIEM settings in SureMDM Web Console.
Splunk Integration in SureMDM Web Console
To integrate Splunk with SureMDM Web, follow these steps:
Navigate to SureMDM Web Console > Settings (icon located at the top right of the screen) > Account Settings > SIEM Integration.
Configure the following required settings and click Save.
| Settings | Description |
|---|---|
| Enable SIEM Integration | Allows configuring SIEM settings. |
| Select Server | Select the SIEM tool as Splunk from the dropdown menu. |
| HEC Token | Enter the token copied from Step no.11 of Splunk Configuration |
| Host URL | Enter the URL copied from Step no. 11 of Splunk Configuration. |
| Source Type, Source (optional) | Enter the details. For Example: Source Type: UEMLogs Source: 42Gears |
Now 42Gears UEM is integrated with Splunk. The system activity logs and device logs recorded in SureMDM Web Console will get updated automatically in Splunk every 24 hours.
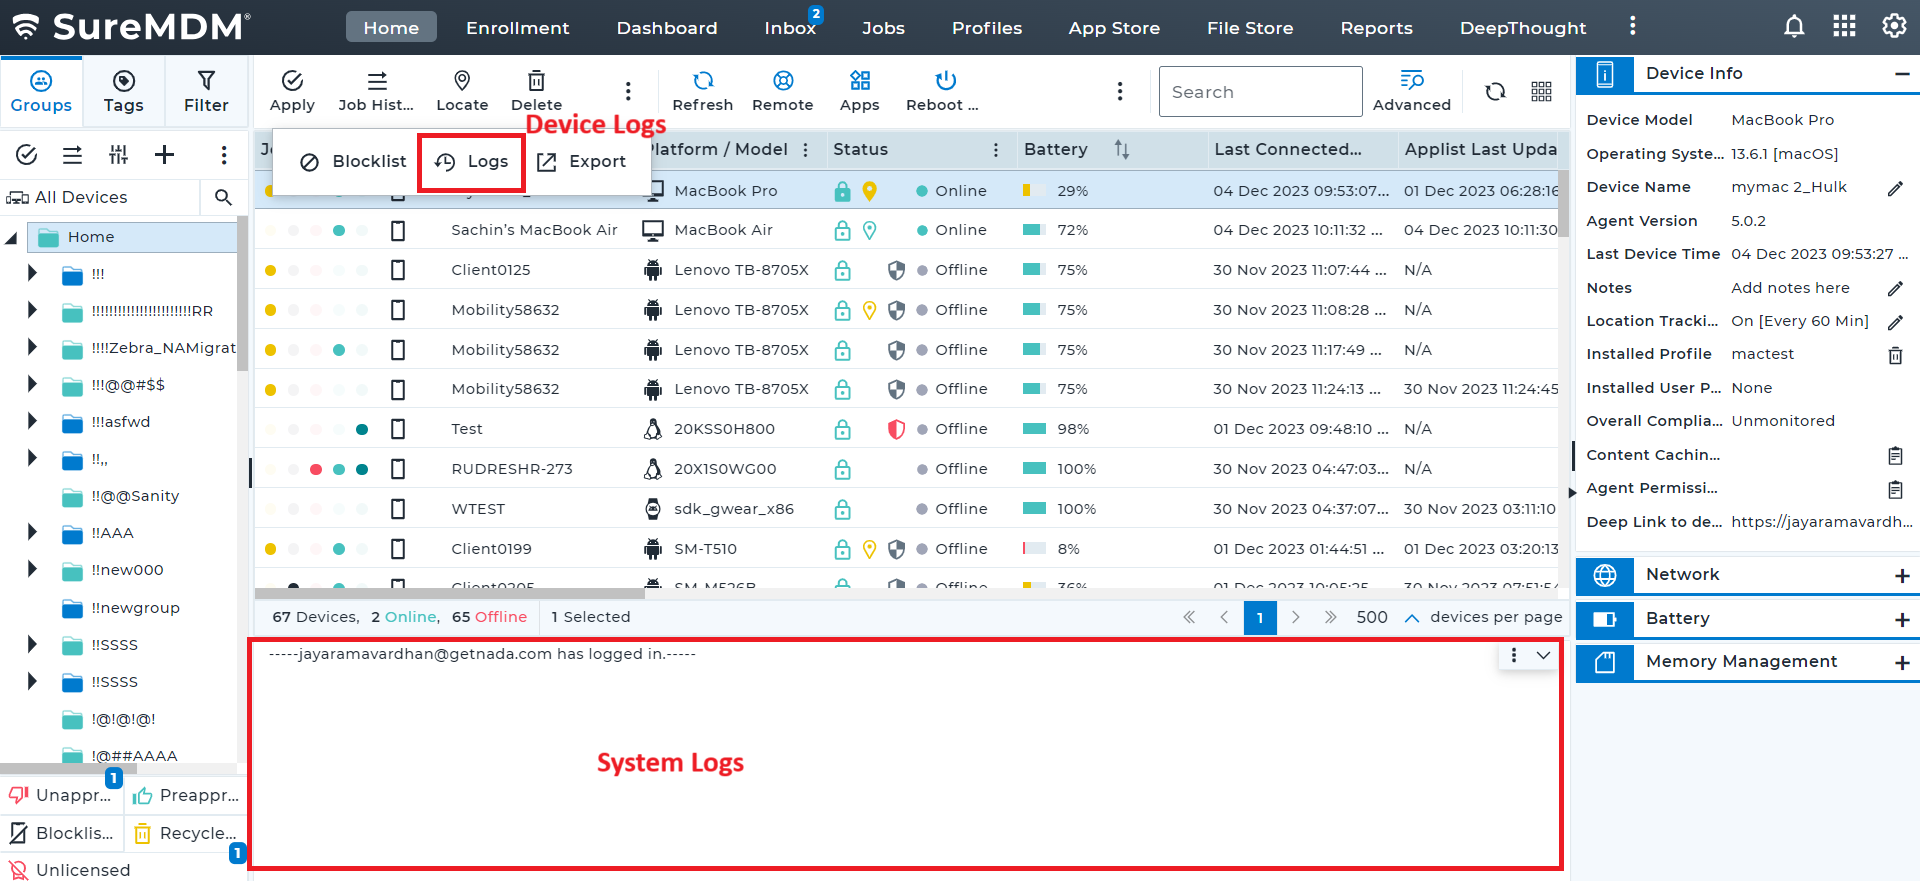
Access Logs in Splunk
After the successful integration of 42Gears UEM account with Splunk, the log details recorded in the console will get updated automatically and these log details can be easily accessed.
To access the log details from Splunk, follow these steps:
Login to Splunk with the login credentials.
Go to Instances and click Access Instances.
Select Search & Reporting > Data Summary.
Select the host from Hosts tab.
All the SureMDM account’s system logs and device logs will be displayed.