iOS Performance
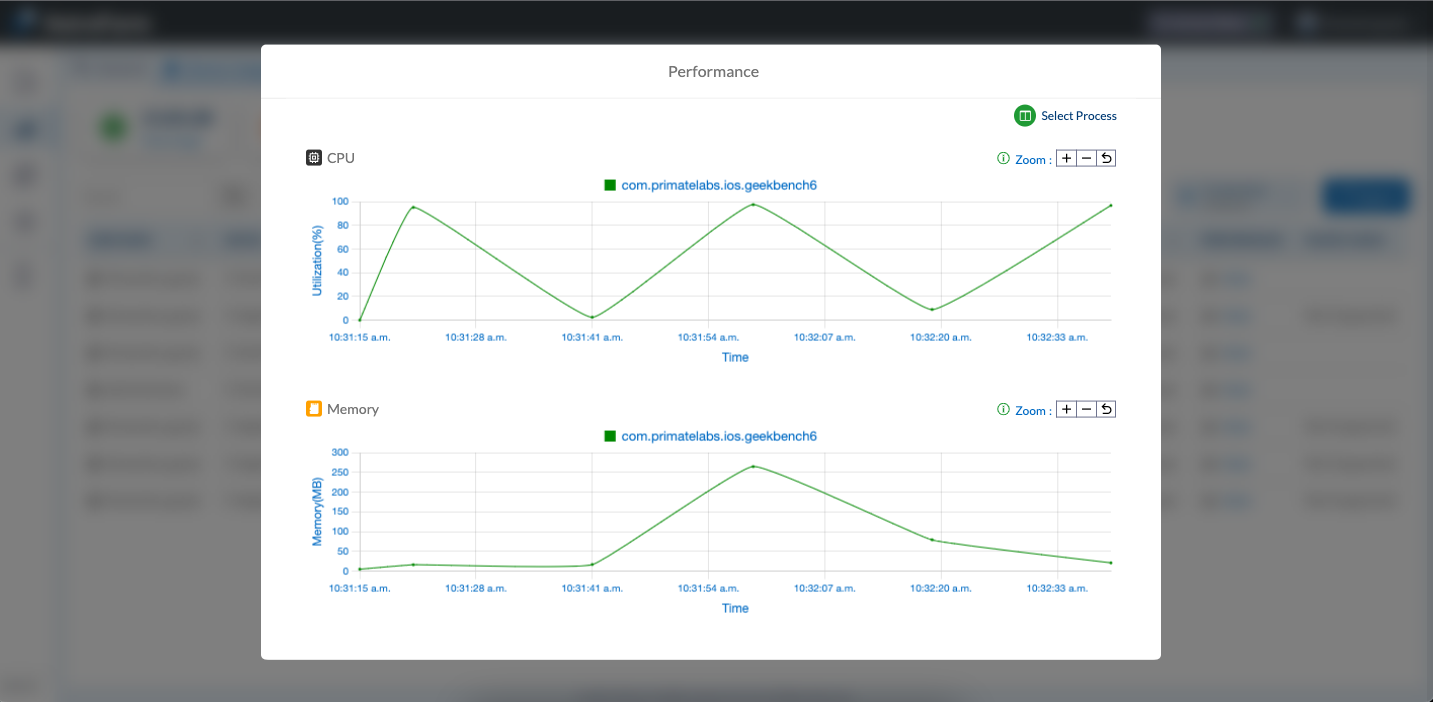
The Performance section in AstroFarm allows users to monitor the device's vitals while using the device to conduct test execution. This information is crucial for diagnosing performance issues and optimizing the mobile app's performance for maximum efficiency.
In the Performance section, users can view a detailed graph of CPU and memory utilization over time. The graph displays the percentage of CPU and memory usage, allowing users to compare apps and easily identify any spikes or trends in usage.
Follow the below steps to access the performance graph for iOS devices enrolled on AstroFarm:
1. Log into the AstroFarm console.
2. Go to Devices.
A list of enrolled devices will be displayed on the device grid.
3. Select the iOS device in the Use state.
4. The Device Control page appears with the selected device screen.
5. Go to the Performance tab to view the CPU and memory usage.
6. The default value displayed on the graphs is for the Mobile Safari application.
7. Using the Select Process button, you can also select another application to monitor CPU and memory usage. In this way, you can install and compare the performance trends of the desired applications.
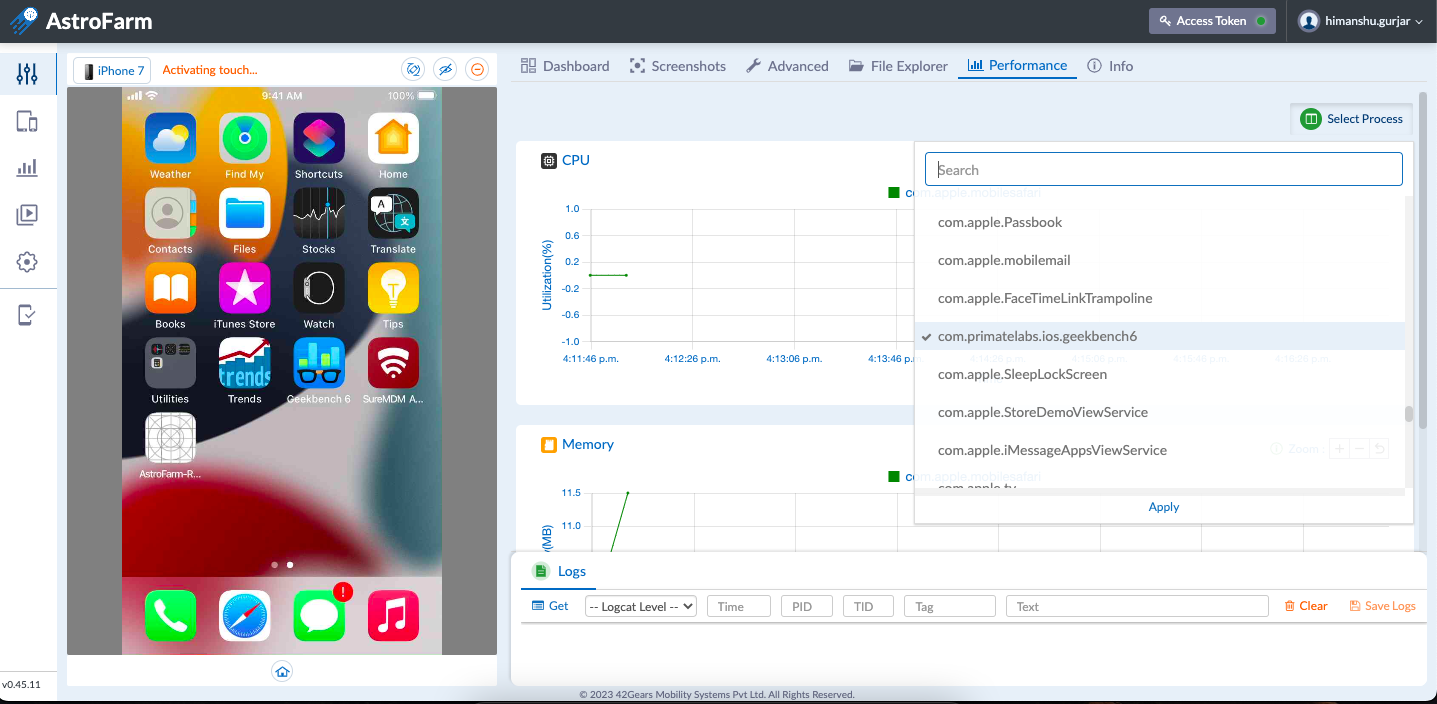
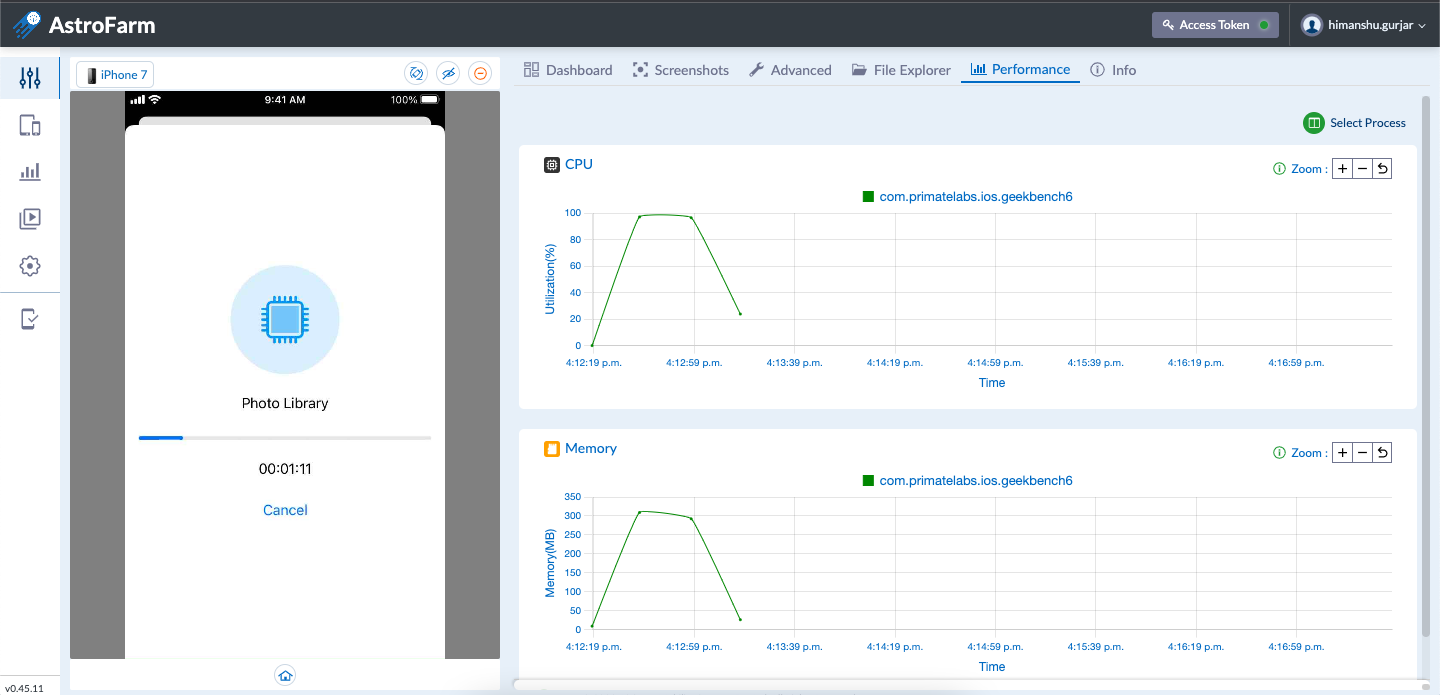
8. Use the Zoom In and Zoom Out options to increase or decrease the size of the graph.
9. Users can view the history of the usage graph for the last device session under the Reports section.
10. Navigate to Reports > Device Usage Logs and click on view under the performance column.