Dashboard
SureMDM Web Console has an HTML5 based dashboard. Admins can sort, filter and organize to get customized panels with summarized views of device parameters. It is an easy-to-comprehend, one-page graphical representation view of device details, their status, alerts, notifications and more.
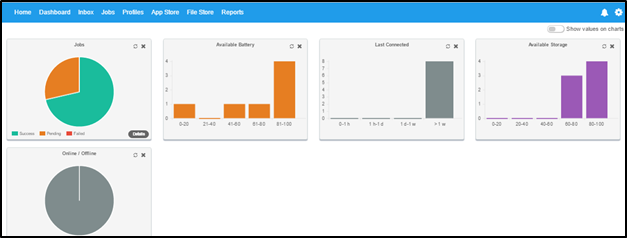
To view SureMDM Dashboard, click Dashboard from Utility Panel. Based on the parameters selected in the left panel, corresponding charts will get displayed on the Dashboard.
 Note: i. In some charts, admins can click and view the device details of a specific parameter.
For example: If admins want to view the pending jobs of all platforms, click Pending section of the Jobs chart and view the device details that are pending to apply.
ii. To display values on the charts, turn on Show values on charts.